
Quick Take
- SBI posted Q1 FY27 standalone net profit of Rs 21,121 Cr ($2.22 Bn), up 10.23% year-on-year.
- Net interest income rose 14.88% to Rs 46,992 Cr, while gross NPA ratio improved to 1.47%.
- Shares jumped nearly 4% on August 7 as lower provisions and strong loan growth lifted earnings.
In This Article
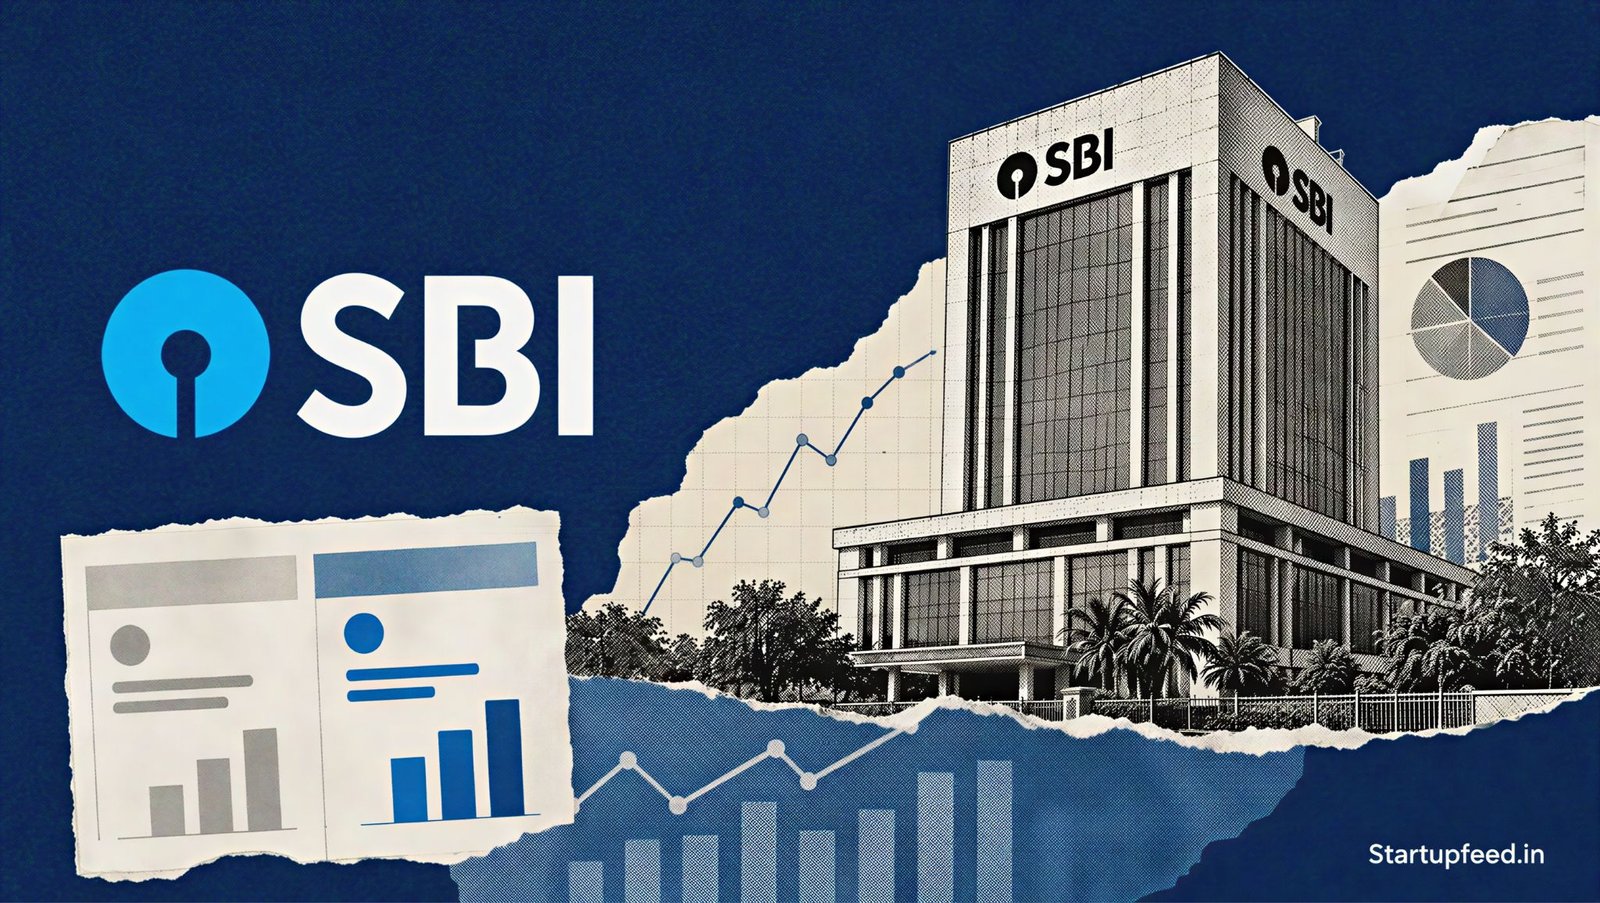
SBI Q1 profit rose 10.23% year-on-year to Rs 21,121 Cr ($2.22 Bn at Rs 95.10/USD) for the quarter ended June 30, 2026 (Q1 FY27), the country’s largest lender reported on August 7, 2026, driven by a sharp rise in net interest income and lower loan-loss provisions.
The standalone figure compares with Rs 19,160 Cr in the year-ago quarter, according to SBI’s stock exchange filing. On a sequential basis, net profit rose 7.30% from Rs 19,684 Cr in Q4 FY26. On a consolidated basis, net profit climbed 13.73% to Rs 24,113 Cr. The results beat most brokerage estimates, several of which had projected a second straight quarter of profit decline.
StartupFeed Insight
The real story sits below the headline profit. SBI’s provisions fell hard, with credit cost dropping to 0.27% from 0.47% a year ago, which flattered the bottom line more than core margins did. Whole-bank NIM still slipped to 2.86%, so the profit beat leaned on asset-quality gains, not pricing power. Deposit-cost watchers and PSU bank investors should track the next two quarters closely. Repo-linked loans reprice faster than deposits, so margin pressure is not over. Expect SBI to guide domestic NIM back above 3% by Q3 FY27, and the market will judge the stock on whether it holds that line. By Avinaash.
SBI Q1 Profit and Results Breakdown
SBI Q1 profit for FY27 reached Rs 21,121 Cr on a standalone basis, a 10.23% year-on-year rise reported on August 7, 2026. Net interest income (NII), the gap between interest earned on loans and interest paid on deposits, rose 14.88% to Rs 46,992 Cr from Rs 40,907 Cr a year earlier. Operating profit grew 9.77% to Rs 33,529 Cr. Full details appear in SBI’s Q1 FY27 analyst presentation published on its corporate portal.
| Metric | Detail | Notes |
|---|---|---|
| Net Profit (standalone) | Rs 21,121 Cr ($2.22 Bn) | +10.23% YoY, +7.30% QoQ |
| Net Profit (consolidated) | Rs 24,113 Cr ($2.54 Bn) | +13.73% YoY |
| Net Interest Income | Rs 46,992 Cr | +14.88% YoY |
| Operating Profit | Rs 33,529 Cr | +9.77% YoY |
| Whole-Bank NIM | 2.86% | Down from 2.89% YoY |
| Announcement Date | August 7, 2026 | Q1 FY27 (Apr-Jun 2026) |
The standout number is the NII jump. It reversed two quarters of near-flat interest income and signals that loan-book growth is now feeding the top line, per SBI’s regulatory filing.
About State Bank of India
State Bank of India (SBI) is the country’s largest commercial bank by assets, deposits, and branch network, tracing its roots to 1806 and the Imperial Bank of India. Headquartered in Mumbai and chaired by CS Setty, the government-majority lender runs retail, corporate, treasury, and international banking, plus subsidiaries in cards, mutual funds, and insurance. It reported gross advances of Rs 50.47 lakh crore and total deposits of Rs 60.06 lakh crore as of June 2026.



What Drove SBI’s Q1 Profit Higher?
SBI’s Q1 profit rose mainly on stronger interest income and a steep fall in provisions. Interest income grew 8.54% to Rs 1,27,896 Cr, while provisions dropped, cutting credit cost to 0.27% from 0.47% a year ago, according to the bank’s filing. Domestic net interest margin improved 7 basis points sequentially to 3.00%.
At SBI, our strategic direction continues to be guided by a simple philosophy: Digital First, Customer First and Nation Always, CS Setty, Chairman, State Bank of India, said.
Loan growth stayed the bright spot. Gross advances rose 18.63% year-on-year, with agriculture loans up 25.43% and SME advances up 22.33%. That momentum, paired with lighter provisioning, lifted earnings even as whole-bank margins stayed under pressure.
How Strong Is SBI’s Asset Quality Now?
SBI’s asset quality improved across every key ratio in Q1 FY27. The gross non-performing asset (GNPA) ratio fell to 1.47% from 1.83% a year ago, while the net NPA ratio eased to 0.38% from 0.47%, the bank reported. Gross NPAs in value terms declined to Rs 74,272 Cr from Rs 78,040 Cr a year earlier, even as advances grew sharply.
The slippage ratio, a measure of fresh bad loans, eased to 0.57% from 0.75%. Provision coverage ratio (PCR) including advances under collection stood at 91.82%, up from 91.71% a year ago. These readings gave SBI room to release provisions and support the profit beat.
How Does SBI Compare With Rivals?
SBI’s Q1 FY27 profit growth of 10.23% keeps it ahead of several public sector peers on scale, though private lenders still post higher margins. SBI’s whole-bank NIM of 2.86% trails large private banks that operate above 3.5%, a structural gap for the PSU sector.
| Bank | Q1 FY27 Net Profit | GNPA Ratio |
|---|---|---|
| SBI (standalone) | Rs 21,121 Cr | 1.47% |
| SBI Cards | Rs 664 Cr | Not directly comparable |
What sets SBI apart is reach: a deposit base of Rs 60.06 lakh crore and a branch network no private rival can match, which anchors its low-cost funding.
What’s Next
SBI has guided for domestic NIM above 3% in FY27, a mark it has missed for two straight quarters. The next test comes in Q2 FY27 results, likely in early November 2026, when investors will check whether loan repricing and deposit costs let the bank hold that margin line. Can SBI turn strong loan growth into steady margin gains, or will deposit costs keep the pressure on?


Disclaimer: This article is for informational purposes only and does not constitute investment advice. StartupFeed and its authors are not SEBI-registered investment advisors. The analysis above is based on publicly available information and should not be the sole basis for any investment decision. Please consult a SEBI-registered financial advisor before making investment decisions.
Frequently Asked Questions
Have a tip? Write to us at editorial@startupfeed.in.
Liked this story? Follow StartupFeed on Google so our reporting reaches you first.